若该文为原创文章,转载请注明原文出处
本文章博客地址:https://hpzwl.blog.csdn.net/article/details/125596677
红胖子(红模仿)的博文大全:开发技术集合(包含Qt实用技术、树莓派、三维、OpenCV、OpenGL、ffmpeg、OSG、单片机、软硬结合等等)持续更新中…(点击传送门)
Qt开发专栏:三方库开发技术
上一篇:没有了
下一篇:《Qt+ECharts开发笔记(二):Qt窗口动态调整大小,使ECharts跟随Qt窗口大小变换而变换大小》
前言
使用Qt开发大数据可视化看板,基于Qt使用QWidget或者QML是很难达到ECharts大数据看板的效果,所以使用Qt来制作。
核心思想
每一个ECharts图表使用一个无边框的QWebView来展示,这样多个不同类型的ECharts图表就是多个封装不同类型ECharts图表的QWebView(html加载入QWebView窗口来实现),每一个模块封装的数据用qt预留接口调用js代码实现修改html的功能,最终达到代码操作qt即可操作图表的功能。
Demo演示
:ECharts介绍、下载和Qt调用ECharts基础柱状图Demo(图1)")
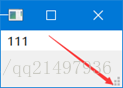
为了实现我们多模块化,窗口的背景透明是很关键的,测试背景透明:
:ECharts介绍、下载和Qt调用ECharts基础柱状图Demo(图2)")
提升窗口背景透明效果:
:ECharts介绍、下载和Qt调用ECharts基础柱状图Demo(图3)")
测试结果可以达到预期。
ECharts
简介
ECharts,缩写来自 Enterprise Charts,商业级数据图表,是百度的一个开源的数据可视化工具,一个纯 Javascript 的图表库,能够在 PC 端和移动设备上流畅运行,兼容当前绝大部分浏览器(IE6/7/8/9/10/11,chrome,firefox,Safari等),底层依赖轻量级的 Canvas 库 ZRender,ECharts 提供直观,生动,可交互,可高度个性化定制的数据可视化图表。创新的拖拽重计算、数据视图、值域漫游等特性大大增强了用户体验,赋予了用户对数据进行挖掘、整合的能力。
主要功能
ECharts 提供了常规的折线图、柱状图、散点图、饼图、K线图,用于统计的盒形图,用于地理数据可视化的地图、热力图、线图,用于关系数据可视化的关系图、treemap、旭日图,多维数据可视化的平行坐标,还有用于 BI 的漏斗图,仪表盘,并且支持图与图之间的混搭。
下载
官网地址:echarts.apache.org
在线定制:echarts.apache.org/zh/builder.html
一个一个封装,所以仅勾选柱状图
:ECharts介绍、下载和Qt调用ECharts基础柱状图Demo(图4)")
:ECharts介绍、下载和Qt调用ECharts基础柱状图Demo(图5)")
经过等待:
:ECharts介绍、下载和Qt调用ECharts基础柱状图Demo(图6)")
然后会卡住,卡住的原因是因为勾选了“兼容IE8”,所以补勾选久可,请耐心等下,最后会下载一个js,如下图:
:ECharts介绍、下载和Qt调用ECharts基础柱状图Demo(图7)")
:ECharts介绍、下载和Qt调用ECharts基础柱状图Demo(图8)")
那么直接使用全部下下来的吧,3.5MB左右,并不是很大,后续如果细化发布再看使用到了什么去定制什么。
Qt中引入ECharts
步骤一:引入web模块
这个很关键,在Qt5.6以后使用了谷歌浏览器内核,不再支持mingw32版本的,所以要使用msvc版本的Qt。
:ECharts介绍、下载和Qt调用ECharts基础柱状图Demo(图9)")
msvc遇到了错误,参照《关于 Qt编译时使用msvc编译器报错“Error: cannot open …main.obj.10836.32.jom for write” 的解决方法》解决。
QT += webenginewidgets1
步骤二:初始化窗口
构造函数中,置0
BarEChartWidget::BarEChartWidget(QWidget *parent) :
    QWidget(parent),
    ui(new Ui::BarEChartWidget),
    _pWebEngineView(0),
    _pWebEnginePage(0),
    _pWebChannel(0),
    _htmlDir("D:/qtProject/echartsDemo/echartsDemo/modules/barEChartWidget/html"),    // 使用了绝对路径,引到html文件夹
    _indexFileName("barEChartWidget.html")
{
    ui->setupUi(this);

    QString version = "v1.0.0";
    setWindowTitle(QString("Qt调用EChartsDemo %1(长沙红胖子 QQ:21497936 WX:15173255813 blog:hpzwl.blog.csdn.net").arg(version));

    // 设置无边框,以及背景透明
    // 背景透明,在界面构架时,若为本窗口为其他窗口提升为本窗口时,
    // 则再qss会在主窗口第一级添加frame_all,防止其他窗口提升本窗口而冲掉qss设置
//    setWindowFlag(Qt::FramelessWindowHint);
    setAttribute(Qt::WA_TranslucentBackground, true);

    // 让滚动条不出来
    resize(600 + 20, 400 + 20);

    initControl();
}
一个是浏览器窗口初始化,一个是js交互的初始化
void BarEChartWidget::initControl(){
    _pWebEngineView = new QWebEngineView(this);
    _pWebEnginePage = new QWebEnginePage(this);
    _pWebChannel = new QWebChannel(this);
    QString filePath;#if 0
    filePath = QString("%1/%2").arg(_htmlDir).arg(_indexFileName);#else
    filePath = "qrc:/barEChartWidget/html/barEChartWidget.html";#endif
    LOG << "file exist:" << QFile::exists(filePath) << filePath;#if 0    // 打印html文件内容
    QFile file(_indexFilePath);
    file.open(QIODevice::ReadOnly);
    LOG << QString(file.readAll());
    file.close();#endif
    _pWebEnginePage->load(QUrl(filePath));
    _pWebEnginePage->setWebChannel(_pWebChannel);
    _pWebEngineView->setPage(_pWebEnginePage);    // 背景透明//    _pWebEngineView->setStyleSheet("background-color: transparent");//    _pWebEnginePage->setBackgroundColor(Qt::transparent);}123456789101112131415161718192021222324252627
步骤三:窗口大小跟随
void BarEChartWidget::initControl(){
_pWebEngineView = new QWebEngineView(this);
_pWebEnginePage = new QWebEnginePage(this);
_pWebChannel = new QWebChannel(this);
QString filePath;
#if 0
filePath = QString("%1/%2").arg(_htmlDir).arg(_indexFileName);
#else
filePath = "qrc:/barEChartWidget/html/barEChartWidget.html";
#endif
LOG << "file exist:" << QFile::exists(filePath) << filePath;
#if 0
// 打印html文件内容
QFile file(_indexFilePath);
file.open(QIODevice::ReadOnly);
LOG << QString(file.readAll());
file.close();
#endif
_pWebEnginePage->load(QUrl(filePath));
_pWebEnginePage->setWebChannel(_pWebChannel);
_pWebEngineView->setPage(_pWebEnginePage);
// 背景透明
// _pWebEngineView->setStyleSheet("background-color: transparent");
// _pWebEnginePage->setBackgroundColor(Qt::transparent);
}
模块化
这是柱状图模块。
:ECharts介绍、下载和Qt调用ECharts基础柱状图Demo(图10)")
Demo
BarEChartWidget.h
#ifndef BARECHARTWIDGET_H#define BARECHARTWIDGET_H
#include <QWidget>
#include <QWebEngineView>
#include <QWebEnginePage>
#include <QWebChannel>
namespace Ui {
class BarEChartWidget;
}
class BarEChartWidget : public QWidget
{
Q_OBJECT
public:
explicit BarEChartWidget(QWidget *parent = 0);
~BarEChartWidget();
protected:
void initControl();
protected:
void resizeEvent(QResizeEvent *event);
private:
Ui::BarEChartWidget *ui;
private:
QWebEngineView *_pWebEngineView; // 浏览器窗口
QWebEnginePage *_pWebEnginePage; // 浏览器页面
QWebChannel *_pWebChannel; // 浏览器js交互
QString _htmlDir; // html文件夹路径
QString _indexFileName; // html文件
};
#endif // BARECHARTWIDGET_H
BarEChartsWidget.cpp
#include "BarEChartWidget.h"#include "ui_BarEChartWidget.h"
#include <QFile>
#include <QMessageBox>
// QtCreator在msvc下设置编码也或有一些乱码,直接一刀切,避免繁琐的设置
#define MSVC
#ifdef MSVC
#define QSTRING(s) QString::fromLocal8Bit(s)
#else
#define QSTRING(s) QString(s)
#endif
#include <QDebug>
#include <QDateTime>
//#define LOG qDebug()<<__FILE__<<__LINE__
//#define LOG qDebug()<<__FILE__<<__LINE__<<__FUNCTION__
//#define LOG qDebug()<<__FILE__<<__LINE__<<QThread()::currentThread()
//#define LOG qDebug()<<__FILE__<<__LINE__<<QDateTime::currentDateTime().toString("yyyy-MM-dd")
#define LOG qDebug()<<__FILE__<<__LINE__<<QDateTime::currentDateTime().toString("yyyy-MM-dd hh:mm:ss:zzz")
BarEChartWidget::BarEChartWidget(QWidget *parent) :
QWidget(parent),
ui(new Ui::BarEChartWidget),
_pWebEngineView(0),
_pWebEnginePage(0),
_pWebChannel(0),
_htmlDir("D:/qtProject/echartsDemo/echartsDemo/modules/barEChartWidget/html"), // 使用了绝对路径,引到html文件夹
_indexFileName("barEChartWidget.html")
{
ui->setupUi(this);
QString version = "v1.0.0";
setWindowTitle(QString("Qt调用EChartsDemo %1(长沙红胖子 QQ:21497936 WX:15173255813 blog:hpzwl.blog.csdn.net").arg(version));
// 设置无边框,以及背景透明
// 背景透明,在界面构架时,若为本窗口为其他窗口提升为本窗口时,
// 则再qss会在主窗口第一级添加frame_all,防止其他窗口提升本窗口而冲掉qss设置
// setWindowFlag(Qt::FramelessWindowHint);
setAttribute(Qt::WA_TranslucentBackground, true);
// 让滚动条不出来
resize(600 + 20, 400 + 20);
initControl();
}
BarEChartWidget::~BarEChartWidget()
{
delete ui;
}
void BarEChartWidget::initControl()
{
_pWebEngineView = new QWebEngineView(this);
_pWebEnginePage = new QWebEnginePage(this);
_pWebChannel = new QWebChannel(this);
QString filePath;
#if 0
filePath = QString("%1/%2").arg(_htmlDir).arg(_indexFileName);
#else
filePath = "qrc:/barEChartWidget/html/barEChartWidget.html";
#endif
LOG << "file exist:" << QFile::exists(filePath) << filePath;
#if 0
// 打印html文件内容
QFile file(_indexFilePath);
file.open(QIODevice::ReadOnly);
LOG << QString(file.readAll());
file.close();
#endif
_pWebEnginePage->load(QUrl(filePath));
_pWebEnginePage->setWebChannel(_pWebChannel);
_pWebEngineView->setPage(_pWebEnginePage);
// 背景透明
// _pWebEngineView->setStyleSheet("background-color: transparent");
// _pWebEnginePage->setBackgroundColor(Qt::transparent);
}
void BarEChartWidget::resizeEvent(QResizeEvent *event)
{
if(_pWebEngineView)
{
_pWebEngineView->setGeometry(rect());
}
}
barEChartWidget.html
<!DOCTYPE html><html>
<head>
<meta charset="utf-8" />
<title>ECharts</title>
<!-- 引入刚刚下载的 ECharts 文件 -->
<!-- <script src="echarts.js"></script>-->
<script src="./echarts.js"></script>
<!-- <script src="D:/qtProject/echartsDemo/echartsDemo/modules/barEChartWidget/html/echarts.js"></script>-->
<!-- <script src="echarts.min.js"></script>-->
<!-- <script src="./echarts.min.js"></script>-->
<!-- <script src="./html/echarts.min.js"></script>-->
<!-- <script src="D:/qtProject/echartsDemo/echartsDemo/modules/barEChartWidget/html/echarts.min.js"></script>-->
</head>
<body>
<!-- 为 ECharts 准备一个定义了宽高的 DOM -->
<div id="main" style="width:600px; height:400px;"></div>
<script type="text/javascript">
// 基于准备好的dom,初始化echarts实例
const myChart = echarts.init(document.getElementById('main'));
// 指定图表的配置项和数据
var option = {
title: {
text: 'ECharts 入门示例'
},
tooltip: {},
legend: {
data: ['销量']
},
xAxis: {
data: ['衬衫', '羊毛衫', '雪纺衫', '裤子', '高跟鞋', '袜子']
},
yAxis: {},
series: [
{
name: '销量',
type: 'bar',
data: [5, 20, 36, 10, 10, 20]
}
]
};
// 使用刚指定的配置项和数据显示图表。
myChart.setOption(option);
</script>
</body>
</html>
工程模板v1.0.0
:ECharts介绍、下载和Qt调用ECharts基础柱状图Demo(图11)")
入坑
入坑一:“js: Uncaught TypeError: echarts.init is not a function”错误
问题
:ECharts介绍、下载和Qt调用ECharts基础柱状图Demo(图12)")
:ECharts介绍、下载和Qt调用ECharts基础柱状图Demo(图13)")
:ECharts介绍、下载和Qt调用ECharts基础柱状图Demo(图14)")
各种测试都不行:
:ECharts介绍、下载和Qt调用ECharts基础柱状图Demo(图15)")
解决方法
echarts的版本5.x太高,换成低版本的4.x就解决了
https://github.com/apache/echarts/tree/4.9.0/dist
成功加载::ECharts介绍、下载和Qt调用ECharts基础柱状图Demo(图16)")
上一篇:没有了
下一篇:《Qt+ECharts开发笔记(二):Qt窗口动态调整大小,使ECharts跟随Qt窗口大小变换而变换大小》
若该文为原创文章,转载请注明原文出处
本文章博客地址:https://hpzwl.blog.csdn.net/article/details/125596677